PBS in Brief What is PBS and why should you care?
"All good ideas arrive by chance."
Max Ernst
Eventually consistent semantics provide almost no guarantees regarding the recency of data returned (unbounded staleness of versions). Despite these weak guarantees, many data store users opt for eventual consistency in practice--why? It's often faster to contact fewer replicas, and it also results in higher availability. However, instead of relying on anecdotal evidence, we can quantitatively demonstrate why eventual consistency is "good enough" for many users. We can predict the expected consistency of an eventually consistent data store using models we've developed, called Probabilistically Bounded Staleness. Moreover, we can describe the reasons why data is or isn't consistent. It turns out that, in practice, and in the average case, eventually consistent data stores often deliver consistent data. Using PBS predictions, we can optimize the trade-off between latency and consistency and better understand why so many data store users choose eventual consistency in practice.
If you're bored, skip to our cool demo.
If you don't know what eventual consistency means, click here.
If you're a savvy reader or an academic, you're better off reading our (fairly readable) paper (appearing in VLDB 2012).
If you don't like reading, watch a recent talk on PBS. (Slides)
You can also read what other people say about PBS on the web:
- Datastax Blog: Your Ideal Performance: Consistency Tradeoff
- Paper Trail: How consistent is eventual consistency? by Henry Robinson
- Data Beta: Quantifying Eventual Consistency via PBS by Joe Hellerstein
- Eventual Consistency: How Eventual? How Consistent? by Jim Downey
Probabilistically Bounded Staleness
Data stores aren't black boxes. We know how they're built, and, accordingly, should be able to predict how they operate in practice. While eventually consistent data stores make no guarantees about the recency of data they return, we can model their operation to predict what consistency they provide. We call this Probabilistically Bounded Staleness, or PBS.
PBS models staleness according to two metrics: time and versions.
- PBS
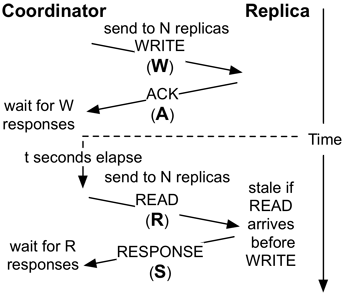
t -visibility models the probability that we will read a valuet seconds after its write completes. This answers the question: how eventual is eventual consistency? - PBS
k -staleness models the probability that we will read a value that is no more thank versions older than the last written version. This answer the question: how consistent is eventual consistency? - PBS <
k,t >-staleness combines these two metrics and models the probability that we will read a value that is no more thank versions older than the last written version if we waitt seconds after the last version was written.
These metrics are expectations, not guarantees. However, as we will see, eventual consistency is often consistent.
Interested in more detail? Click here or read our paper.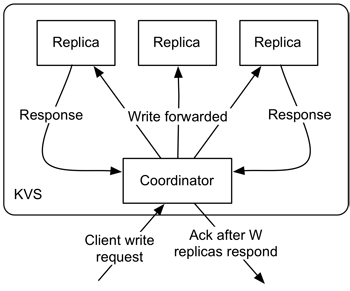
Instructions RTFM.
We've implemented a demo of PBS for Dynamo-style quorums below. The demo is pure client-side Javascript and runs Monte Carlo simulations in your browser. The main graph displays how long you wait after a write commits before reading versus the probability of reading one of the last committed versions. You can mouse-over the graph to see the exact probability and play with the controls to explore a range of configurations.
This demo is strictly for Dynamo-style quorum replication. If that doesn't make sense to you, read the About section or read our paper or the Dynamo paper. We don't model read repair or other anti-entropy; these are rate dependent and result in yet another knob to twiddle (one whose value you can't likely guarantee). Read our paper for more details.
Controls:
- Replica Configuration: Controls the number of replicas contacted for each request (N), the number of responses required before returning from a read (R) and from a write (W).
- Tolerable Staleness: How recent does your data need to be? What's the oldest version you'd like to see? We assume the worst case, where all the writes finished at the same time.
- Accuracy: Monte Carlo simulation means we run repeated trials for a configuration. While the graph should be monotonic (increasing everywhere), because of randomness, it may have dips and spikes; to smooth the curve, increase the number of iterations for each point on the graph using the slider.
- Operation Latency: How long does each message take? (We call this the WARS model in our paper.) Here, each of the four messages (write request, write ack, read request, read response) is delayed according to an exponential distribution. Higher λ correspond to a lower mean and tail.
Note that this is a conservative analysis, which means you should see less staleness in practice. Also, because we're running Monte Carlo analysis with (unbounded) exponential messaging delay, we can never guarantee consistency unless R+W > N, so our maximum confidence (in the captions) is bounded by the number of iterations you run.
How Eventual is Eventual Consistency? PBS in action under Dynamo-style quorums
Write Latency: Median ms, 99.9th %ile ms
Accuracy: iterations/point
λ .100
λ .100
λ .100
λ .100
Questions and some answers. But you should really just read our paper instead.
Most of your questions about the simulation will probably be answered in the instructions section.
If you're interested in more technical detail, read our paper.
How can I use PBS with my data store?
PBS requires
modeling read and write propagation to and from replicas. If you can
measure the write propagation delays (and read messaging delays), you
can predict the consistency provided by your data store. We've
analyzed Dynamo-style systems here and in our paper because they're
widely deployed (and poorly understood). We have successfully
modified Cassandra to provide PBS predictions with high accuracy
(within .28%). If you want to implement PBS for your data store, we
should talk. See our code on Github.
Can you model {read-repair, other anti-entropy, less
conservative analyses, some other latency distribution}?
You
bet! PBS is generic, but this demo simulation is intentionally simple
to make it easier to play with. In our paper, we're conservative
(understating staleness instead of overstating it, when the choice
arises). In general, conservative figures are more broadly
applicable. However, it's easy to accommodate these features, and, if
you're interested, we should talk. We have some real-world latency
distributions in our paper, but you can use whatever you like with
PBS.
Should I use eventual consistency in my data store?
Consistency requirements vary from application to application. PBS is intended as a
descriptive tool for determining the consistency provided by
eventually consistent data stores but may strengthen the case for using
eventual consistency in practice.
More Info Awesome! What next?
PBS was developed at UC Berkeley. The PBS team is Peter Bailis, Shivaram Venkataraman, Joe Hellerstein, Mike Franklin, and Ion Stoica.
Our paper on PBS detailing precise semantics for t-visibility, k-staleness, and <k,t>-staleness will appear in VLDB 2012. You can read our paper here.
The Javascript implementation of the PBS Monte Carlo analysis used on this page is pretty short and well-commented. The code is not too difficult, and we welcome any improvements. (Yes, we too think Javascript is ugly.) We have a patch for Cassandra to analyze the consistency of production clusters.
If you have any questions or want to talk about PBS, please feel free to send us a tweet or drop us a line at .
We're super excited about real people and real problems. Again, if you or your organization want to talk, let us know. Bay Area travel is easy.
Acknowledgments
Many kind folks provided useful feedback on our work, including Marcos Aguilera, Peter Alvaro, Eric Brewer, Neil Conway, Greg Durrett, Alex Feinberg, Ali Ghodsi, Hariyadi Gunawi, Coda Hale, Bryan Kate, Sam Madden, Bill Marczak, Kay Ousterhout, Christopher Re, Scott Shenker, Sriram Srinivasan, Doug Terry, Greg Valiant, and Patrick Wendell. This acknowledgement does not imply any sort of endorsement--merely a thank-you. Any errors or inaccuracies are attributable to the authors alone.
This work was supported in part by AMPLab gifts from Google, SAP, Amazon Web Services, Blue Goji, Cloudera, Ericsson, General Electric, Hewlett Packard, Huawei, IBM, Intel, MarkLogic, Microsoft, NEC Labs, NetApp, Oracle, Quanta, Splunk, VMware and by DARPA (contract #FA8650-11-C-7136). This material is based upon work supported by the National Science Foundation Graduate Research Fellowship under Grant No. DGE 1106400.